



This is a guest post titled “A Beginner’s Guide to Dimensions in Google Analytics,” but from the wealth of information included, it’s way more than a Beginner’s Guide.
What Dimensions in Google Analytics is, and how can it help you.
If you’re not familiar with Dimensions in Google Analytics, not to worry. In it’s most explanation of it is:
Dimensions in Google Analytics are attributes that describe your data — things like page title, source, device, or location. They’re used to categorize and segment your metrics, which helps you analyze your traffic in more detail.
Data is what helps you understand how people interact with your website.

By analyzing data generated by interactions with your website, you are able to establish what is working and make better, informed decisions about improving user experience and increasing return on marketing spend. Google Analytics provides the data required to make such decisions.
There is one key concept to Google Analytics (GA) called Dimensions. Using Dimensions you can slice and dice your data in the best way possible. You can for example see which traffic sources is bringing the most engaged visitors. How different pages perform across devices? Mastering dimensions helps you understand your audience beyond surface metrics.
New to Google Analytics? Check out our Google Analytics setup guide for tracking correct data from the very beginning.
An Overview of Google Analytics

See how to read your Google Analytics here.
Did you know that 14.2 million websites use Google Analytics? No matter if you are running a blog or an online e-commerce shop – measuring user interactions on your website is very important. By using Google Analytics (GA) you can get a great overview of what is going on.
Google Analytics helps to track and analyze website traffic. Google Analytics tracks the visitors to your website by means of a tracking code (GA4’s gtag.js) which you add to your website. Google Analytics will make reports for every visitor to your website, based on the pages they visited. This information will be included in reports. You can access detailed reports on user demographics, traffic sources, and important metrics for your website.Without data, making decisions about your website is just guesswork. GA provides clear answers to critical questions:
- Where is your traffic coming from?
- What content keeps visitors engaged?
- Which marketing efforts drive conversions?
Businesses and organizations can use Google Analytics data to boost ROI and improve user experience on websites.
Google Analytics 4 (GA4) offers more advanced AI insights, event tracking, and cross-platform measurement than Universal Analytics. GA4 focuses on user behavior on devices and therefore offers a complete audience overview for companies.
What Is a Dimension in Google Analytics?
When you analyze website data, you need more than just numbers—you need context. Dimensions provide context to the numbers in GA. If you see 10,000 page views, ask: Who generated them? Which sources brought visitors here?
Dimensions break down these numbers to help understand the bigger picture and make data-driven decisions. It answers key questions like:
- Who is visiting your site? (e.g., New vs. Returning Visitors)
- Where are they coming from? (e.g., Country, Traffic Source)
- What pages are they viewing? (e.g., Landing Page, Page Title)
- How are they interacting? (e.g., Device Type, Browser)
GA Dimensions and Metrics
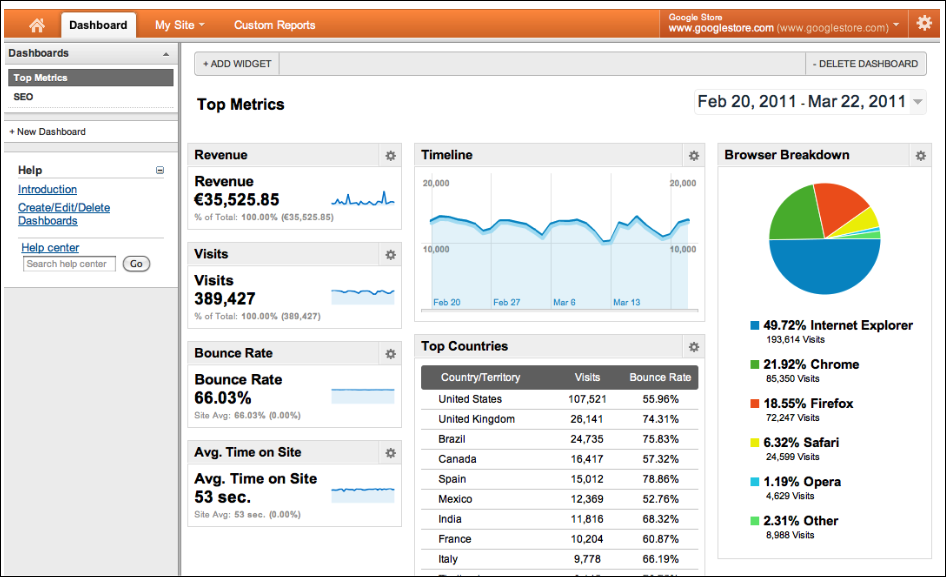
Dimensions and Metrics work together, but they serve different purposes:
- Dimensions describe data (they categorize users, sessions, or actions). An example is: “Which traffic source brought the most visitors?” → Answer: “Google, Facebook, Direct.”
- Metrics measure data (they provide numerical values). An example is: “How many visitors came from Google?” → Answer: “3,500 sessions.”
Dimensions and Metrics are paired in reports to extract meaningful insights. Here are some examples:
- Dimension: Traffic Source + Metric: Sessions → See which platforms drive the most traffic.
- Dimension: Landing Page + Metric: Bounce Rate → Identify pages where visitors leave quickly.
- Dimension: Device Category + Metric: Conversion Rate → Compare how well mobile vs. desktop users convert.
How Do Google Analytics Dimensions Work?

In Google Analytics (GA and GA4), Dimensions give context to data by categorizing user interactions, helping you analyze visitors and their site interactions.GA4’s event-based model records every user action—clicks, page views, form submissions—as events. Dimensions are attached to these events to provide additional details. For example:
- A purchase event can include Dimensions like “Product Category” and “Traffic Source.”
- A video play event can include Dimensions like “Video Title” and “User Location.”
- A form submission event can include Dimensions like “Page Title” and “Device Category.”
This flexibility allows for more detailed GA4 tracking across web and mobile platforms, giving businesses a complete view of the customer journey.
Types of Dimensions in Google Analytics
Google Analytics groups Dimensions into levels based on data scope. Knowing these categories aids accurate website traffic analysis and prevents confusion. Here’s a breakdown:
User-Level Dimensions
User-level Dimensions provide attributes about an individual visitor. These Dimensions persist across multiple sessions, helping you analyze long-term user behavior.
Example Dimensions:
- Age & Gender – Available if you enable Demographics reports.
- Interests – Shows user affinity categories (e.g., “Tech Enthusiasts”).
- User ID – A custom identifier if you’ve set up user tracking.
If you want to analyze how different age groups engage with your website over time, user-level Dimensions provide a broad, long-term view of behavior.
Session-Level Dimensions
Session-level Dimensions describe attributes of a single visit to your website. Each session starts when a user arrives and ends after 30 minutes of inactivity (by default).
Example Dimensions:
Source/Medium – Identifies where a user came from (e.g., Google/Organic, Facebook/Paid).
- Source/Medium – Identifies where a user came from (e.g., Google/Organic, Facebook/Paid).
- Campaign – Tracks specific marketing campaigns.
- Device Category – This shows if a session happened on a mobile, desktop, or tablet.
If you’re running a paid ad campaign, session-level Dimensions help you see which campaigns drove traffic and how users behaved in those sessions.
Hit-Level Dimensions
Hit-level Dimensions describe individual interactions within a session—each page view, event, or transaction counts as a “hit.” These Dimensions capture granular details.
Example Dimensions:
- Page URL – The exact page a user viewed.
- Event Category & Event Action – Labels for tracking user interactions (e.g., clicking a button or watching video content).
- Transaction ID – Unique identifier for purchases.
If you want to track how users interact with a specific button, hit-level Dimensions help pinpoint the exact action taken.
Product-Level Dimensions
Product-level Dimensions describe individual items in an eCommerce store. These only apply if you’ve enabled Enhanced eCommerce tracking.
Example Dimensions:
- Product Name – The name of the purchased item.
- Product Category – The category assigned to a product.
- Product Brand – The brand associated with the product.
If you want to analyze which product categories generate the most revenue, product-level Dimensions provide insights into sales trends.
Using the wrong Dimension scope can lead to misleading conclusions. So, it is important to align dimensions with the right cope to ensure that your analysis is both accurate and actionable.
Key Dimensions to Track in Google Analytics
Now that we’ve broken down what Dimensions are and how they work, let’s look at the pre-defined Dimensions that offer the biggest value—especially for beginners trying to translate data into decisions.
Source/Medium
Source is the specific origin of your traffic—Google, Facebook, or your newsletter, for example. Medium tells you the category of that source, such as organic, paid, referral, or email. Together, “Source/Medium” paints a full picture of traffic acquisition.
Understanding which channels are delivering results is fundamental to evaluating your marketing efforts. This Dimension helps answer:
- Where are my high-converting users coming from?
- Are organic efforts paying off more than paid efforts?
- Is my newsletter traffic just opening pages or actually engaging?
To use it, head to Traffic Acquisition reports in GA4. Filter by Source/Medium and look at key metrics like sessions, bounce rate, and conversions.
Landing Page
First impressions matter. An optimized landing page attracts users, while a weak one deters them. Analyzing landing pages helps identify top performers and underperformers.You can use it in GA4 by navigating to Engagement > Landing Pages. Evaluate pages with high traffic and high bounce rates—especially if they’re key entry points from campaigns or search.Cross-reference the Landing Page with the Source/Medium to see which pages attract traffic from which sources. This tells you what kind of content is working on which channels.
Device Category
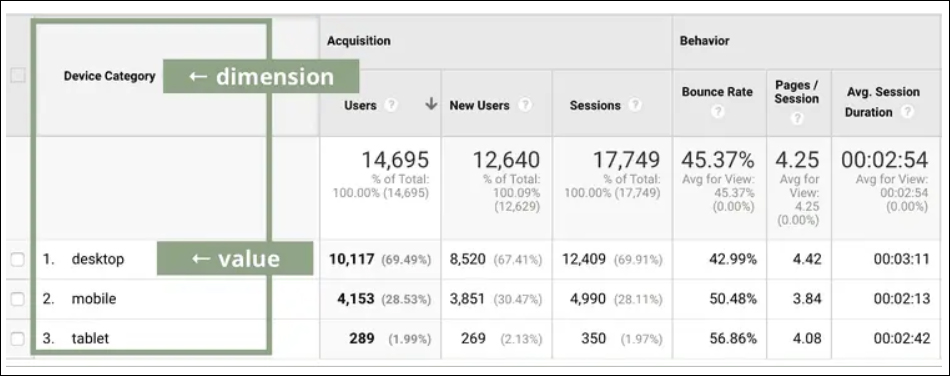
User behavior can vary drastically depending on the device. Conversion rates, page engagement, and even user intent may shift depending on screen size and interface. This Dimension segments users by the type of device they’re using: desktop, mobile, or tablet.
Browser
The Browser Dimension shows visitor browsers—Chrome, Safari, Edge, Firefox, etc.Different browsers may render your website differently. A poor experience on one browser can mean lost trust, missed conversions, or rising bounce rates—and you might not even know it unless you’re looking here.
Country/City
These geographic dimensions reveal user locations down to country, region, or city. Regional data guides localization, content, and geo-targeted marketing. It also helps assess campaign performance by location.
Page Title
This Dimension captures the HTML <title> of the page a user visited, making it easier to identify content when URLs are messy or indistinct. This is especially useful for content-heavy sites like blogs, resources, or media hubs.
Using Dimensions in Reports
Once you understand what Dimensions are and why they matter, the next step is learning how to use them effectively inside Google Analytics reports.
When you’re inside Google Analytics 4 (GA4), most reports come pre-configured with a primary Dimension. But you’re not locked into that view. Google Analytics allows easy switching of the primary Dimension via a drop-down menu near the top of the report table. This allows you to pivot the data based on your analysis goals—say, changing from “Source/Medium” to “Landing Page.”If the primary Dimension gives you the headline, then a Secondary Dimension provides the subtext—the added context that turns numbers into narratives.
Sometimes, the standard reports don’t quite fit your needs. That’s where Explorations (formerly called “Custom Reports”) come into play. It allows you to create customized data views with specific Dimensions and Metrics of your choosing. This is especially helpful when you’re:
- Running A/B tests and want to segment by device or region.
- Monitoring campaign-specific landing pages and traffic sources.
- Investigating behavioral differences between new and returning users.
Creating Custom Dimensions
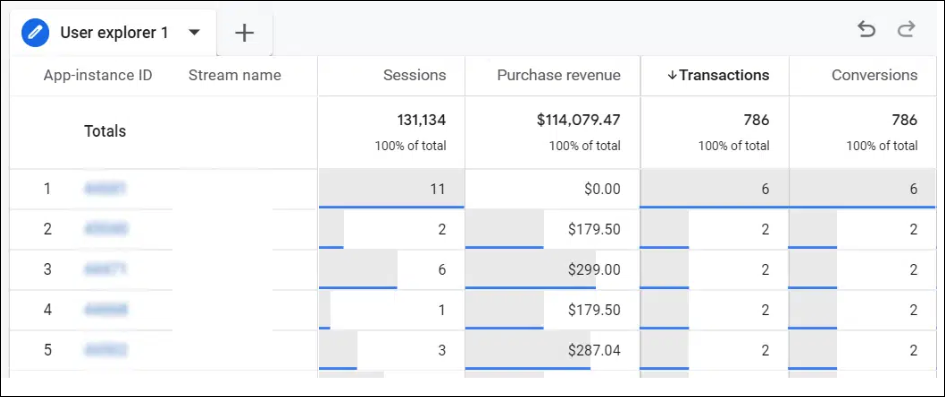
Predefined Dimensions in Google Analytics provide a solid base for analyzing user behavior, but they fall short when tracking unique business factors like logged-in status, membership tier, or content type.Custom Dimensions allow you to capture context that Google Analytics doesn’t track by default, giving you more control and precision over your data. To set it up:
- Head to Explore in GA4.
- Choose a blank exploration or a template.
- Drag and drop your desired Dimensions and Metrics into the Rows, Columns, and Values fields.
- Use Filters to narrow down your data even further.
Tips and Best Practices for Using Dimensions
Dimensions are powerful, but their value depends on how you use them. Here are six principles to help you use Dimensions effectively and avoid analysis paralysis.
Start with a Question
Before diving into reports or adding new Dimensions, ask yourself. “What am I trying to understand?”
This step, often skipped, is crucial. Starting with a clear question guides your analysis and helps identify which Dimensions and Metrics to focus on.
Focus on Actionable Insights
Not all data is useful. Some Dimensions are interesting but won’t help you make better decisions. Your goal is to find signals, whether the data point changes what you do next or supports or challenges your assumptions.
Use Dimensions to reveal friction and surface opportunities and support strategic changes—not just to fill dashboards.
Keep It Simple
Yes, GA4 lets you combine Dimensions in endless ways. But more isn’t always better. Combining too many Dimensions can fragment your data and make patterns harder to see.
Stick to one or two Dimensions at a time—especially when starting out to keep your analysis clear and avoid misleading conclusions due to small sample sizes or skewed data.
Use Segmentation
Segmentation is one of the most underrated features in GA4. It allows you to create focused views of your audience by applying filters or conditions based on Dimensions. You may:
- Segment by Page Title to compare different content types.
- Segment by Campaign to assess performance from a seasonal promo.
- Segment by Country to fine-tune international strategies.
Regularly Review Your Data
Data is only as useful as it is current. Regular review helps you stay responsive and keeps your strategies grounded in reality, not assumptions from last month or even last week—user behavior evolves quickly.
Annotate Key Changes
When updating sites, launching campaigns, or adding new content, track changes with annotations—either directly in GA (if using UA) or in a shared analytics log for GA4.
Why? When Dimensions suddenly change, identify the cause. Tracking key updates provides context and helps avoid overreacting to normal fluctuations.
As if this wasn’t enough information…

At its core, Google Analytics is more than a numbers dashboard—it’s a window into how real people experience your website. And Dimensions are what bring that experience into focus. Adding context with Dimensions turns vague assumptions into confident, data-backed decisions.
Whether you’re tracking traffic sources, identifying poor-performing landing pages, or optimizing for mobile, understanding Dimensions helps improve user experience, boost conversions, and refine marketing.
The best part? You don’t need to master everything at once. Start small. Choose a dimension for a current challenge. Experiment, observe, and adjust. Small, informed changes can make a difference.
 Guest Author’s Bio
A seasoned entrepreneur and digital marketing expert. Kevin started in digital marketing, specializing in Search Engine Optimisation since 2010, and is helping Finance, Insurance, E-commerce, Medical, B2B, and SaaS companies.
Kevin is also a certified adult educator in Singapore, delivering high-quality, relevant, and easy-to-implement training to ensure learners can get immediate results and build upon their knowledge.